Prediction #1: Using Past Election Results
September 9, 2024 – Welcome to the first week of Nick’s Picks, my forecasting model for the 2024 Presidential Election! For this week, I’m starting the basics of my model with a simple factor of prediction: what has happened before.
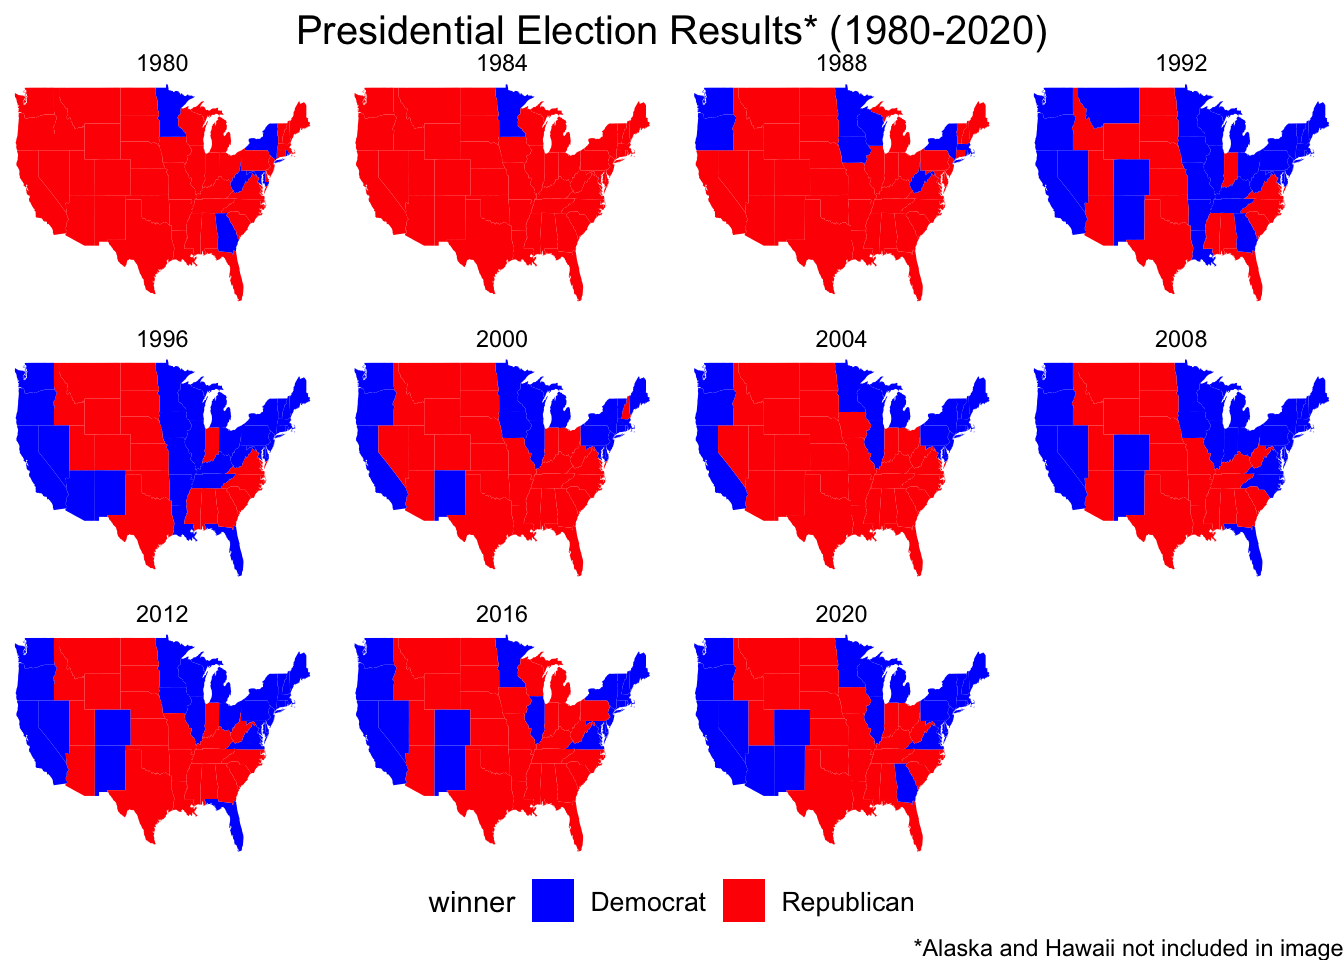
The graph below displays the Electoral College map of every presidential election since 1980. Though there is some variation, it is clear that since 2000, and especially in the past few election cycles, many votes consistently vote for the same party each election on the presidential level, such as the West Coast and New England states voting consistently for the Democrats, and the Deep South and Great Plains states mainly voting for Republican candidates. However, there are a few states in the past few elections that have swung between Democrats and Republicans, including, but not limited to, states such as Wisconsin, Michigan, Pennsylvania, Ohio, Florida, Arizona, and North Carolina.
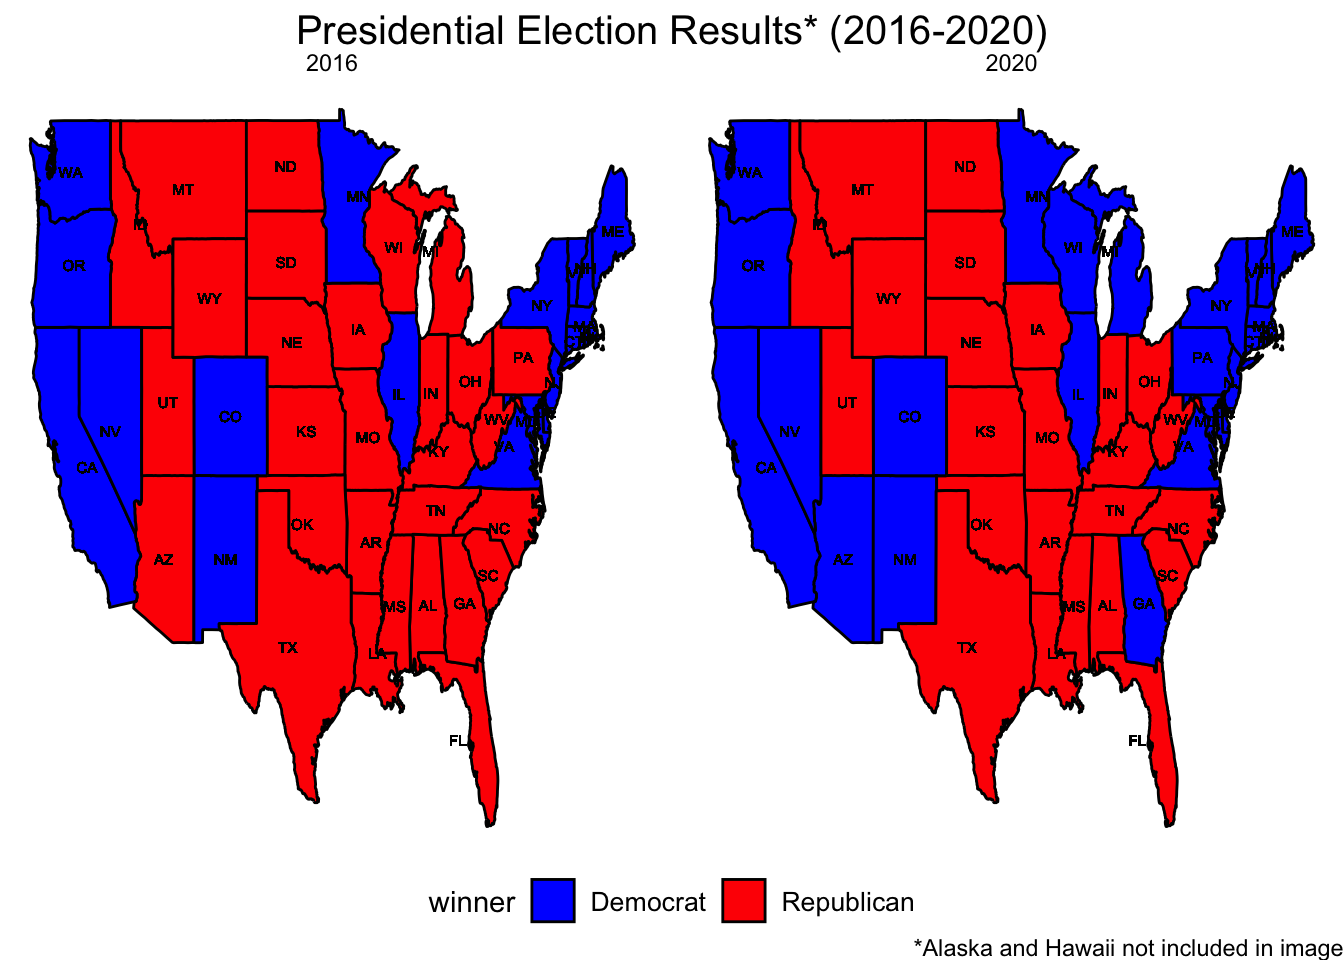
Looking more closely at the two most recent presidential elections, we see that many of these states that have swung between parties in the past few election cycles, were decided by extremely narrow margins. We can see that in 2020, Joe Biden narrowly won the states of Arizona, Georgia, Michigan, Pennsylvania, and Wisconsin, all of which were states narrowly won by Trump in 2016. However, the remainder of the 50 states voted consistently for Republicans or Democrats over these two elections. Therefore, in order to predict the outcome of the 2024 election, it is a good idea to look at historical election data of this time period.
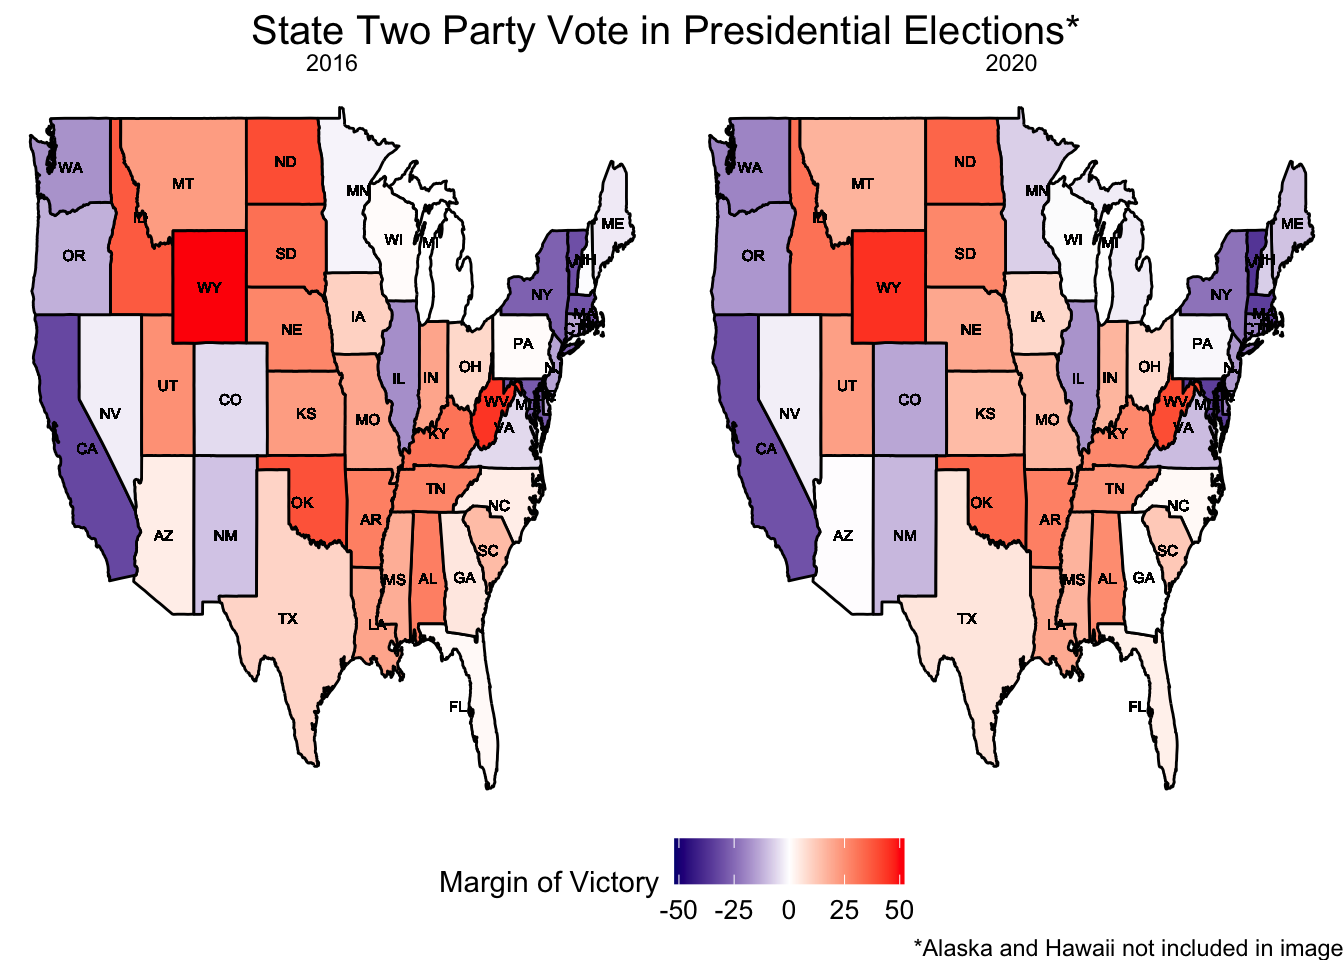
Using these two past presidential elections, I construct my model to predict the two-party vote share and Electoral College results for the 2024 Presidential Election. Although I include both sets of election results, I weigh the 2020 Presidential Election between Trump and Biden more heavily as it was more recent than the 2016 Presidential Election between Trump and Clinton. This division, of a 3/4 weight on the 2020 election and a 1/4 weight on the 2016 election is a simple and common method of distributing model influence when using historical election data.
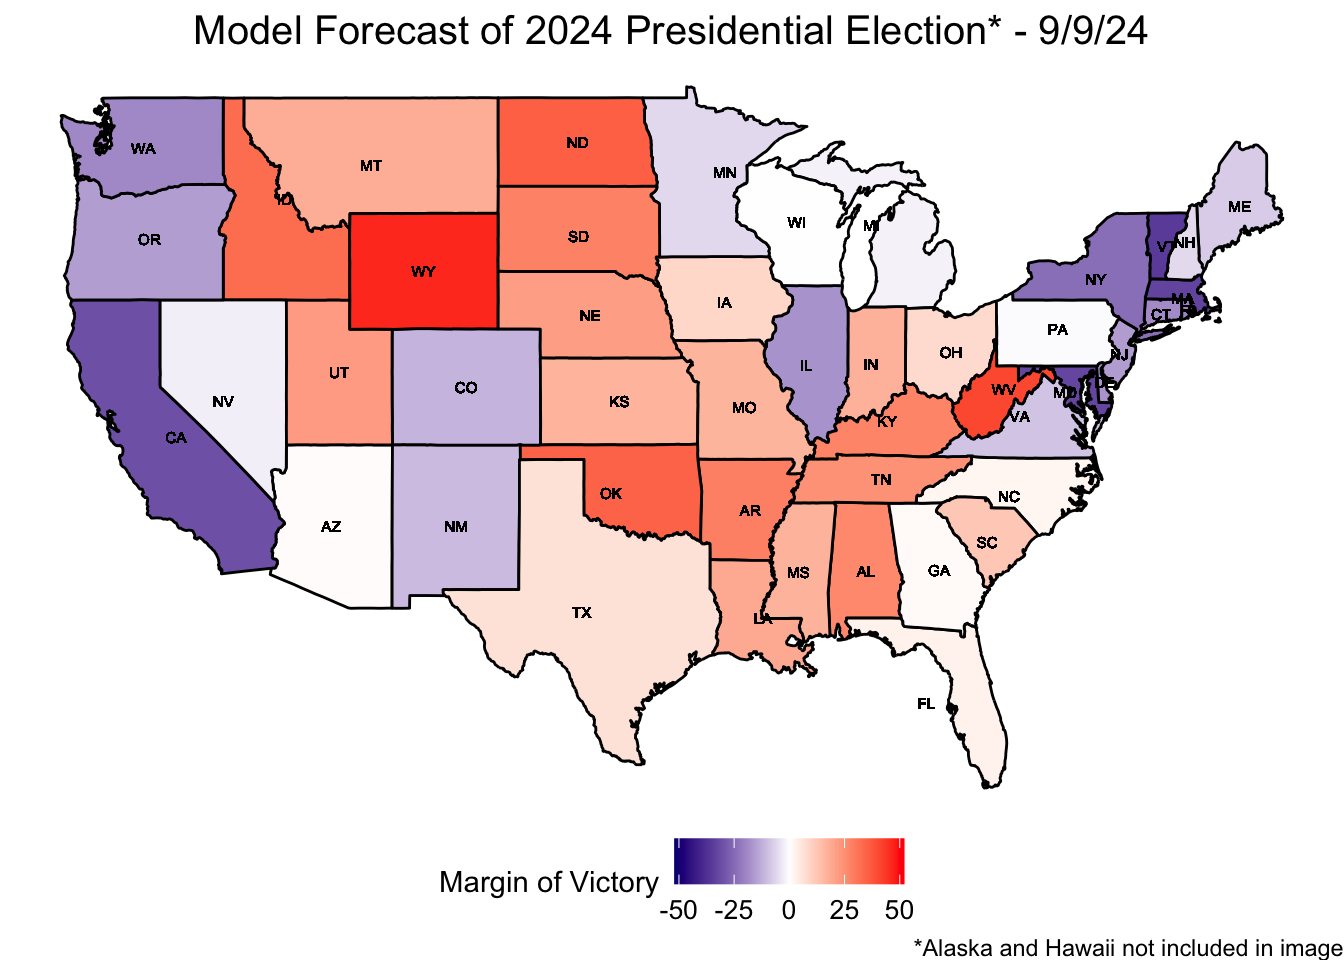
Based on this weighted lagged model of past presidential election results, my model predicts Vice President Kamala Harris wins the national two-party popular vote (disregarding third party candidates) with 51.99% of the vote compared to the Republican candidate, former President Donald Trump’s 48.01%, representing an approximate D+4 environment. However, the winner of the presidential election is not the popular vote winner. The candidate who wins the presidency wins the majority of Electoral College votes based on winning individual states. Therefore, with this two-party vote share model applied to each individual state, my model predicts that Harris will win the 2024 Presidential Election with 276 electoral votes compared to Trump’s 262. This margin is closer than previous elections, such as when Biden won with 306 in 2020, or when Trump won with 304 electoral votes in 2016. A map of this victory is illustrated below. As expected, solidly Democratic and Republican states are forecasted to continue to vote for their respective candidates, while the most competitive states remain in the Rust Belt (WI, MI, PA) and the Sun Belt (NV, AZ, GA, NC).
An important caveat to these projections is that these results are far from my final prediction. This model, an arguably conservative estimate based on averages, assumes that Harris will underperform Biden in 2020 and outperform Clinton in 2016. While historical trends are part of the story, election outcomes are not simply products of previous results. The model in this week’s blog post is simply the start of a months-long project. In subsequent blog posts, I will be adding more variables to my model to create the most accurate prediction of the 2024 presidential election. Stay tuned!