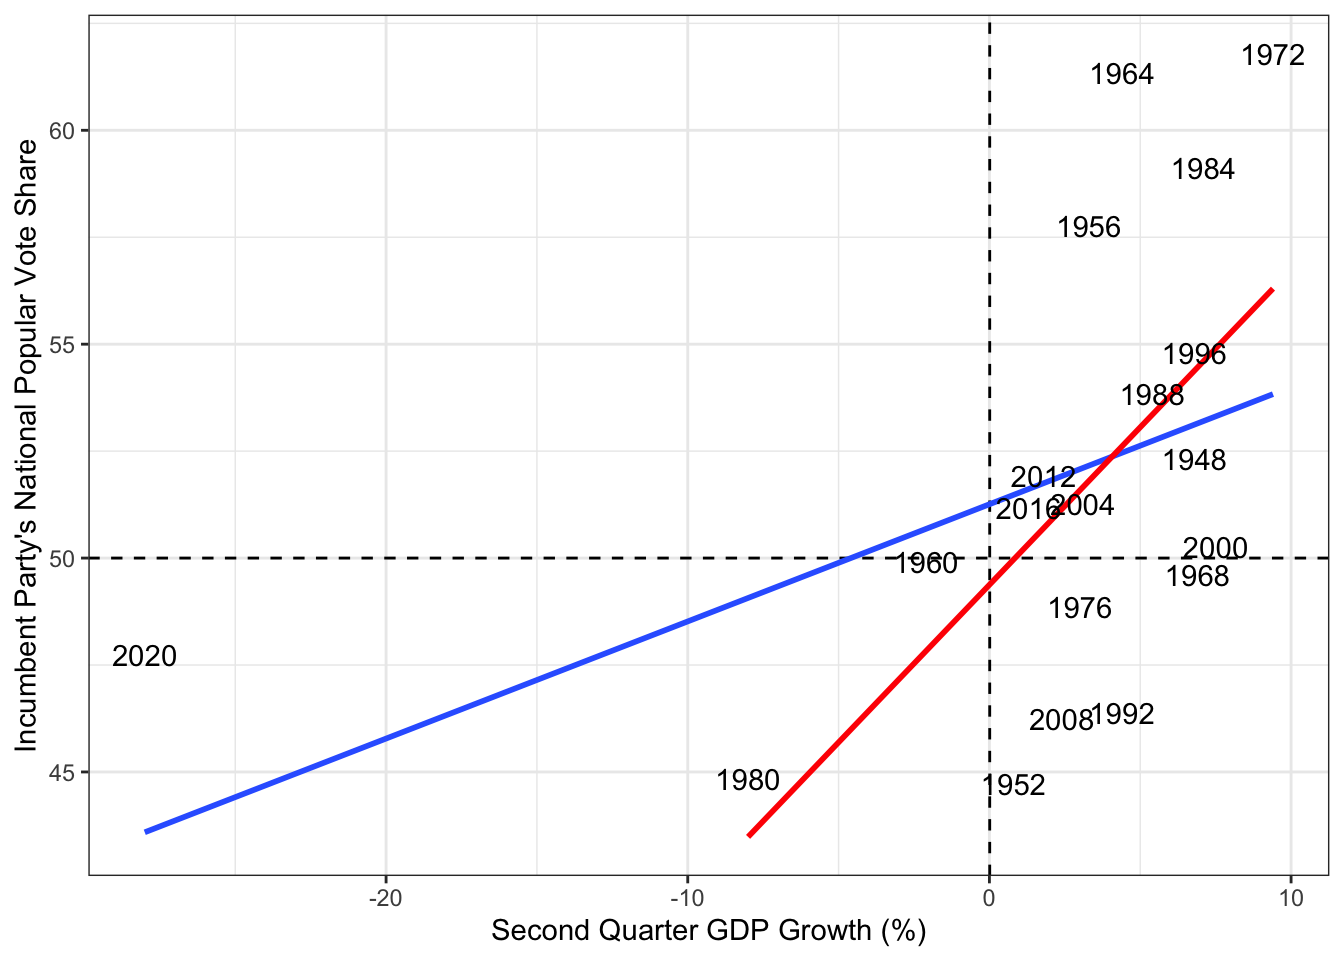
September 16, 2024 - Today marks 50 days until the 2024 Presidential Election. For this week’s model updates, I am focusing on one of the fundamentals of political forecasting: the economy. One of the most famous quotes in the political world belongs to longtime Democratic strategist James Carville, who famously said “It’s the economy, stupid”, and that statement is abundantly true. Americans evaluate the economy and choose candidates based on the recent state of the economy, known as voting retrospectively (Achen and Bartels 2017). Historically, economic metrics from Quarter 2 leading up to the election are strongly correlated with incumbent party vote share, as illustrated by the figures below. The blue line depicts the line of best fit for all years included in the data, white the red line represents the line of best fit for all elections included besides 2020, which was a major outlier on many economic indicators. In general, we can see that incumbent presidents, or their party successors, are rewarded if there was recent growth in Gross Domestic Product.
In my model forecast for this week, I assess how key economic indicators influence peoples’ votes; constructing an OLS linear regression model using Quarter 2 (April, May, June) economic data from 1976 to 2020 as a proxy for perceptions of the economy leading up to the election to predict Democratic candidate two party vote share in each state. My national economic data includes GDP growth, real disposable personal income growth (RDPI), Consumer Price Index (CPI) to cover three highly salient and different aspects of evaluating the economy; national macroeconomic growth, personal finance situation, and inflation, respectively. However, because of the size of the United States, national metrics may not capture individual state trends. Therefore, my model includes average monthly unemployment for the three months of Q2 for each state to try to capture the more localized economic conditions.
In addition to these economic variables, I built upon my model last week by including a lagged variable representing Democrat two-party vote share in the previous presidential election, to account for the influence of partisanship in addition to economic conditions. This is why I chose Democrat two-party vote share to simply predict the winner of each state, as it would be more complicated to create a lagged incumbent party vote share variable instead of just choosing one of the two parties. To account my choice of focusing on one party’s variables and incumbency bias, I include two indicator variables: ‘inc_prez’ that denotes if the current president is running for reelection, and ‘inc_party’ to denote the party of the incumbent president, as voters may hold the incumbent president or political party responsible for current economic conditions.
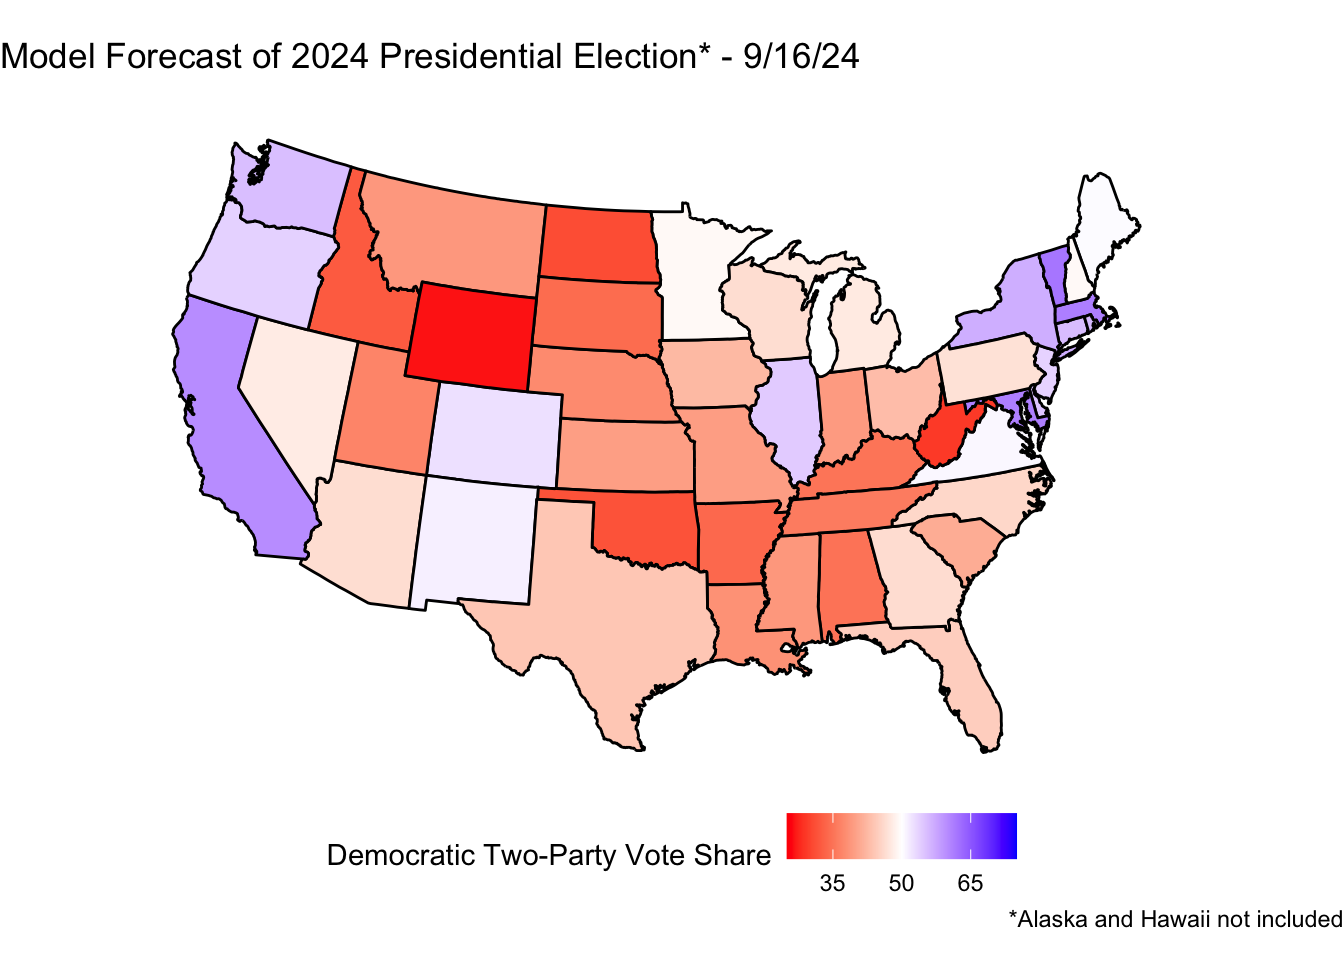
Applying my individual state model including these variables to 2024 data yields dramatically different results than last week’s simple model. My new model, including national economic indicators, state-level unemployment, previous results, and incumbency factors predicts that Republican former President Donald Trump wins the 2024 Presidential Election with 326 electoral votes compared to Democrat Vice President Kamala Harris’ 212 electoral votes. In other words, voters are generally forecasted to punish the incumbent party, the Democratic Party, for the current economic conditions, as Kamala Harris is the current vice president to Democratic President Joe Biden. However, many crucial swing states had predicted Democratic two-party vote shares just below the 50% mark, which means that a Democratic victory is within the margin of error.
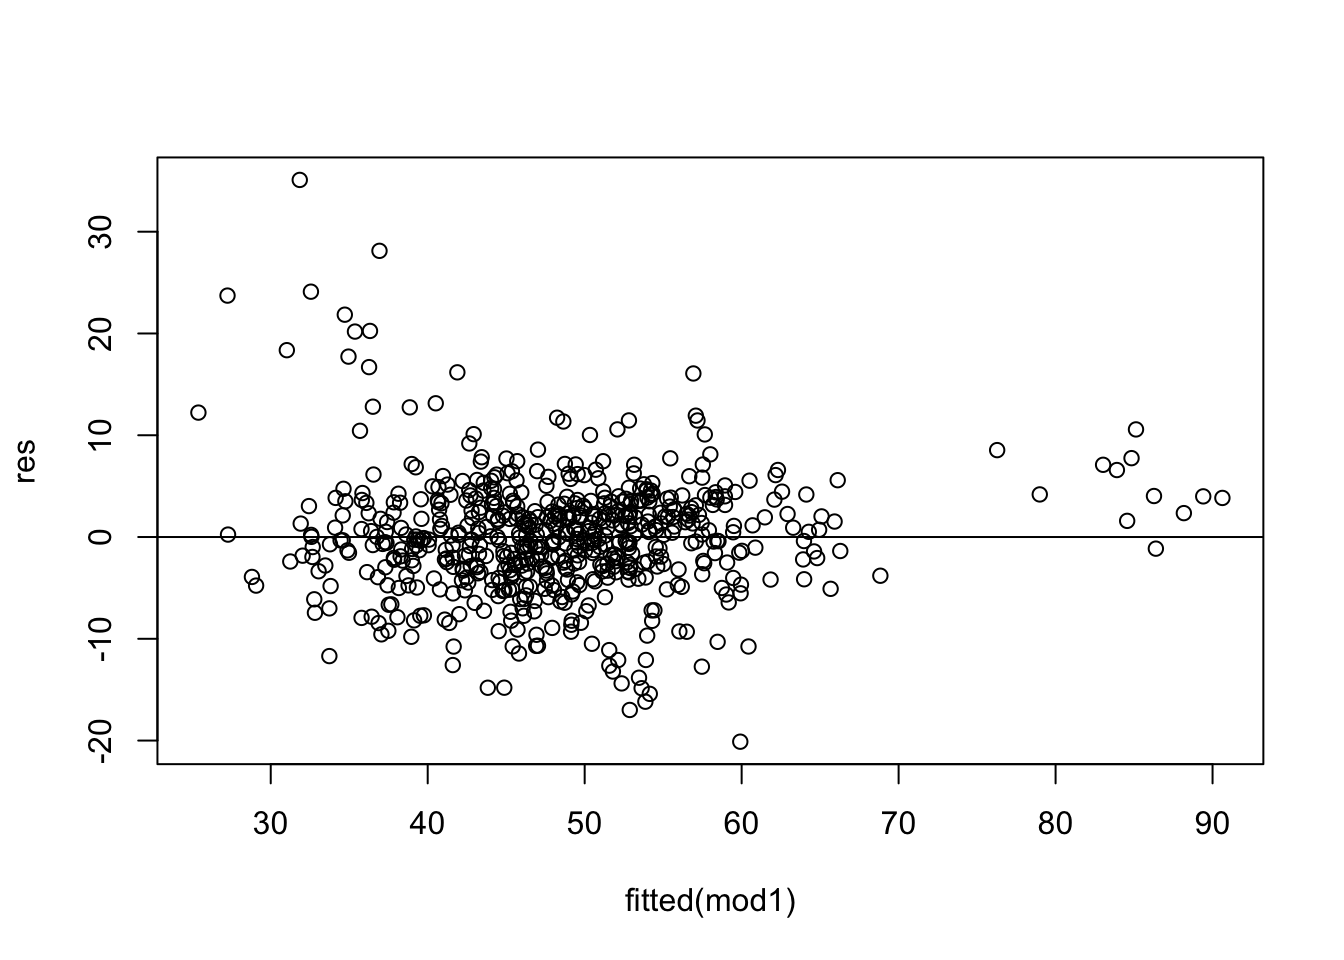
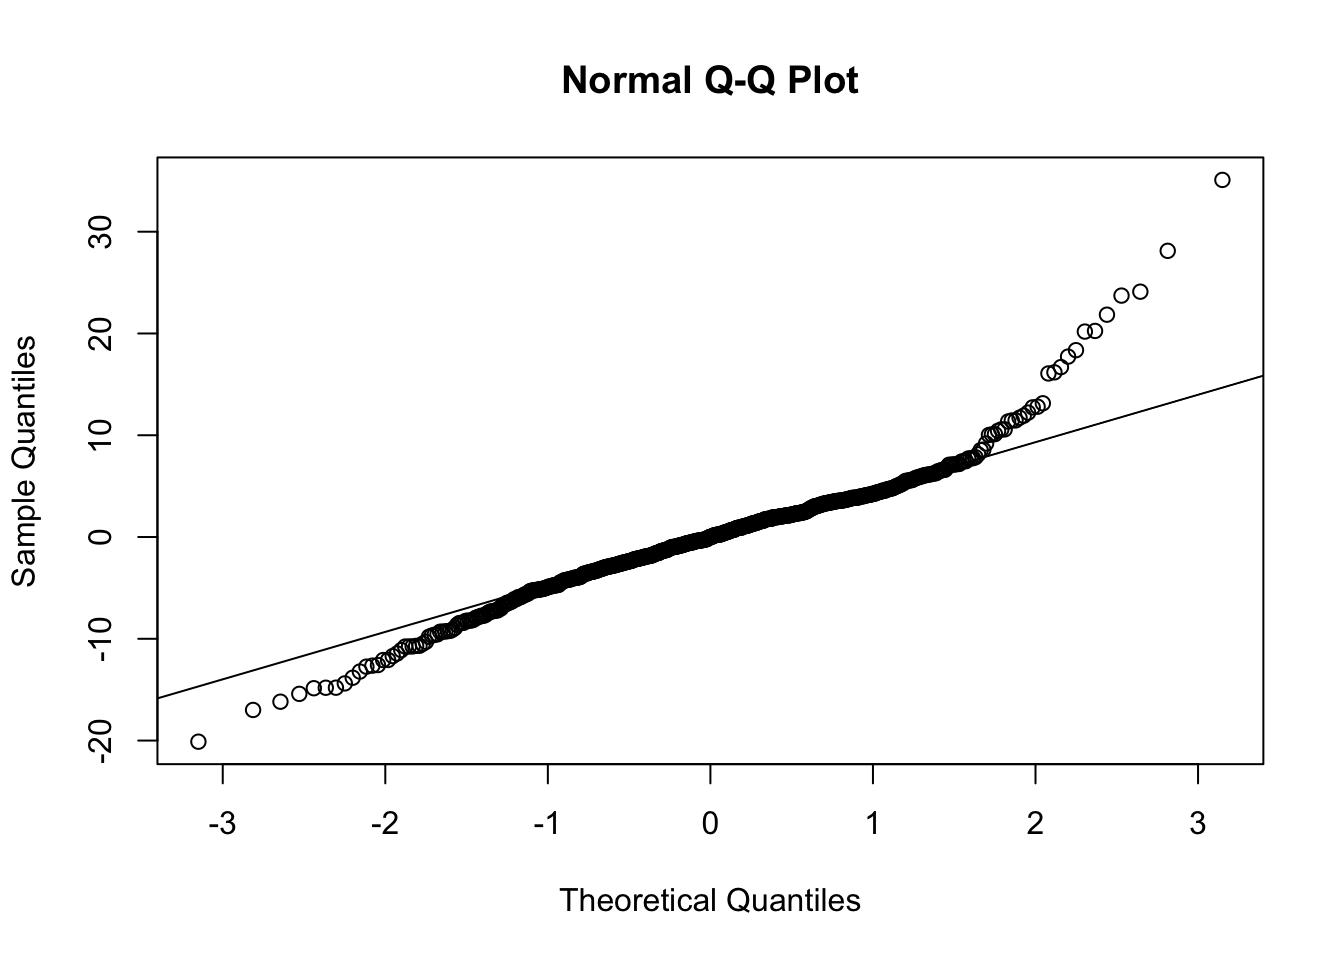
While this may seem like a lopsided forecast, a thousand repetition cross-validation results in a relatively small mean out-of-sample error of -1.129, which indicates that this model has a good fit on this data. Plotting the residuals and a QQ-plot of all the data demonstrate that this model fits the data fairly appropriately, as residuals look decently evenly distributed.
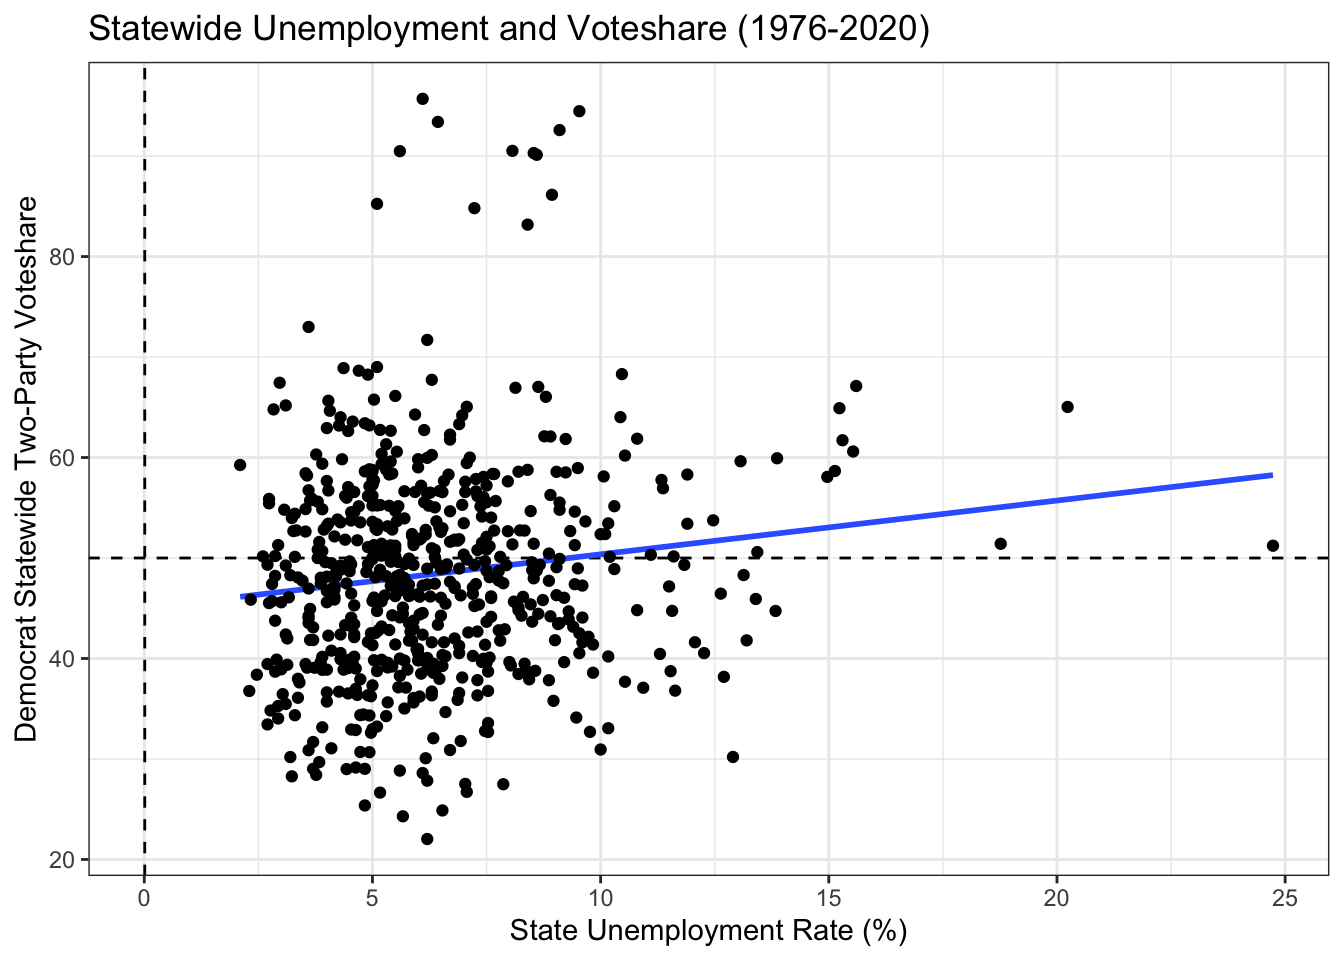
Additionally, I chose state-level unemployment to capture state economic conditions because I had limited data options for this week’s assignment. In my data there is an extremely weak correlation between state unemployment and vote share ( r = 0.13). Perhaps in future models I may find different local economic indicators to better capture these state level effects.