Final Prediction
November 4, 2024 – It’s been a long time coming, but the moment we’ve been waiting for is here. Tomorrow is officially Election Day for the 2024 Presidential Election. Tomorrow, predictions become testable as we begin the multi-day process of counting millions of ballots. Therefore, it is officially time to release my final model, and my final predictions for the 2024 Presidential Election.
Since the beginning of September, I’ve constructed many models with a myriad of different variables to predict vote share. Now, I’ve landed upon what I believe to be an optimal model, or ensemble of models rather, to best predict the outcome of tomorrow’s election.
First, I amassed my state predictions for some of my previous models: the economic fundamentals model, incumbency model, demographics model, FEC contributions model, as these all use various fundamental indicators and barometers of support to predict outcomes. Similar to last week, I updated my simple unpooled polling model using statewide averages of two days prior to Election Day using the difference in average polling between the Democrat and the Republican candidates to predict the Democrat’s two-party vote share, weighted exponentially by year. For the sake of brevity, I will not get into the minutiae of these previous models. More information about each of these models can be found in their respective blog posts in prior weeks.
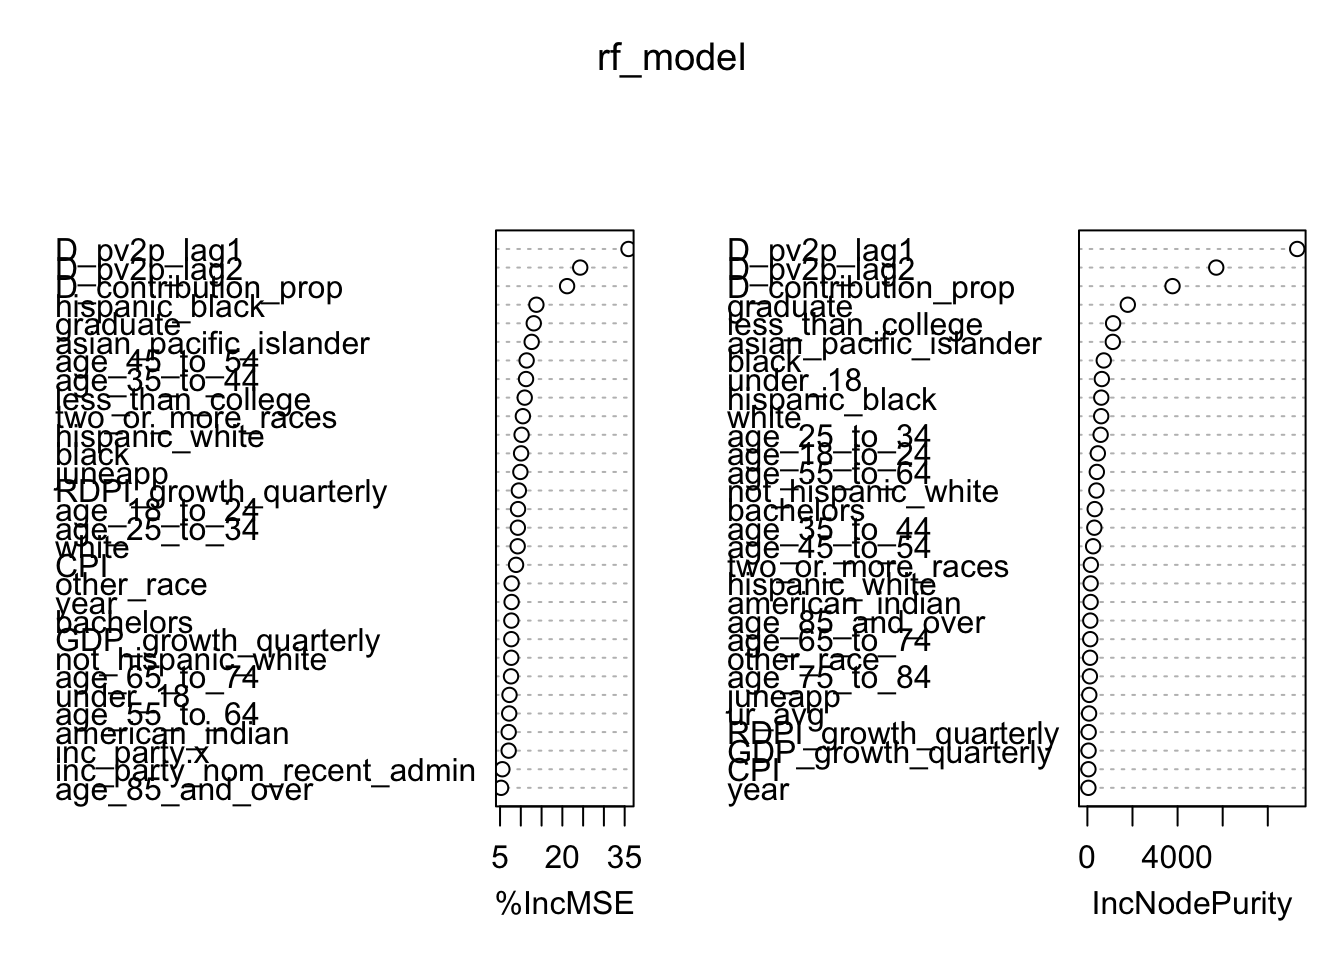
The newest addition to this week is a random forest model constructed of all variables I have used in my aforementioned models, except polling data, as this data is only available for certain states. The random forest model contains state demographic variables (race, age, education), lag vote share, state Q2 unemployment rate, national Q2 GDP growth, Q2 RDPI growth, and CPI; national president approval rating, incumbent indicators, the incumbent party’s duration in power, year, and state proportion of Democrat candidate FEC contributions. I chose to put all of these variables in a random forest model for a more robust prediction based on all of these factors that have been known to influence election outcomes, accounting for the complex relationships and interactions between these variables. This random forest model, built on data from as early 1976, has an in-sample RMSE of 1.27 and an cross-validation out-of-sample RMSE of 3.19.
Using 2024 data from 2008-2020 (years in which all variables are present), I predicted Harris’ two-party vote share. Due to the structure of the random forest, I could not easily compute prediction intervals. Nevertheless, I used this data in my final ensemble model. Below, you can see which variables have the most explanatory power. It seems that lag vote share, FEC contributions (as a measure of enthusiasm), and a state’s percentage of college graduates are the most important predictors of election outcomes according to this model.
I decided to aggregate this diverse set of random forest and OLS models to help make a more accurate final prediction. Since not all models are built the same, I used a weighted average. Ideally, I would weight the model predictions based on their out-of-sample predictive power. However, I was unable to calculate appropriate measurements for some of the models. Therefore, I created my own weighting scheme, emphasizing the Random Forest model because of its low error and robustness, the polling model, due to their ability to directly capture voter sentiment, the FEC contributions model, due to its high importance as shown above, and the economic fundamentals model due to the traditional importance of fundamentals. I downweighted the demographics model because this model had a high out-of-sample RMSE of 6.52 and the demographic data I have is simulated, not actual values. The weighting scheme is shown below. As mentioned earlier, not every state has polling data available in 2024, nor does every model have a computed confidence interval (such as the all-variable random forest), so state weighted average predictions and intervals are calculated from whatever data available.
| Model | Weight |
|---|---|
| Economic Fundamentals | 1.02 |
| Incumbency Factors | 1.00 |
| Demographics | 0.90 |
| FEC Contributions | 1.01 |
| Polling Data | 1.04 |
| All-Variable RF | 1.05 |
Based on my final ensemble model, I officially predict that Democrat Vice President Kamala Harris will win the 2024 Presidential Election with 303 electoral votes, defeating Republican former President Donald Trump, who I predict will win 235 electoral votes. My model predicts that the 2024 election will be a repeat of the 2020 election, with Harris winning every state Biden won in 2020, including the swing states of Wisconsin, Michigan, Pennsylvania, Georgia, Nevada, and Arizona. Her predicted vote shares, compared to Biden’s, are shown below.
As always, predictions have uncertainty. Even though I predict a Harris victory, it is a narrow victory, and my model explicitly shows below that Harris or Trump could either eke out slim wins, or be victorious by large electoral college margins.
And with that, this concludes my series of prediction blogs. Tomorrow, we will find out how my forecast fares, and this time next week, we shall hopefully know who will be the 47th President of the United States of America.