Campaign Narratives: A Closer Look at California
December 10, 2024 – It has now been over a month past the 2024 Presidential Election. As nearly every vote has been counted, we can begin to examine the election with a microscopic lens. Today, for my final post, let’s examine the campaign and election in my home state of California.
State Overview
California is the most populated state in the union, with nearly 40 million people and 54 electoral votes. Almost one quarter of its population lives in Los Angeles County, with millions of others residing in the other population centers of San Diego, Orange County, the Inland Empire, and the San Francisco Bay Area. California is one of the only majority-minority states in the country, with a 40% plurality of Hispanic and Latino residents, followed by 33% non-hispanic white, according to the US Census and American Communities Survey. California’s Latino population consists primarily of Mexican-American individuals, who are concentrated in Southern California, the San Francisco Bay Area, and the Central Valley. White residents of California mostly reside in the northern Bay Area, exurbs, and counties in the Sierra Nevada, while the Asian American 15% of California’s population are concentrated in the Bay Area (San Francisco, Santa Clara, San Mateo, and Alameda counties), Sacramento, and Orange County.
California is also a fairly educated state, with around 36% of adults 25 and older earning a Bachelor’s degree or higher, slightly above the US average. It is also the most urban state, with over 94% of Californians living in an urban area
Given California’s highly urbanized, educated, and racially diverse population, it is no surprise that California is one of the most Democratic states in the country. California has voted for every Democratic presidential nominee since 1992, Democrats hold a large majority of the state’s congressional seats, its two Senate seats, supermajorities in the state legislature, and every statewide elected office. As shown below, since 2000, the Democratic presidential nominee has consistently won the state by double digit margins. Therefore, 2024 was expected to be no different. My forecast predicted that Democrat Vice President Kamala Harris would carry the state with 65.71% of the two-party vote. 538 predicted Harris would win 62.7% of the California vote, Sabato’s Crystal Ball ranked California as “Safe D”, and Cook Political Report rated the state as “Safe D”. In the end, although Harris still won California by a comfortable margin, it was by less than expected. Harris won 60.4% of the two-party vote, the lowest for Democratic presidential nominee since John Kerry in 2004. As shown below, this margin of victory of 20.8 points within my prediction interval, but means that Harris underperformed my prediction by almost 11 points, one of my largest state prediction errors.
California elects its state government offices in midterm years, so the only other statewide constituency elections were the concurrent open general and special Senate elections, in which Democrat Adam Schiff defeated Republican Steve Garvey, by 19.6 and 18.6 points respectively, a slight underperformance compared to Harris, and a lower margin of victory compared to statewide Democrats in 2020 and 2022.
While Democrats fared better in California congressional races this year, what explains the underperformance at the top of the ticket? Why did Harris lose ground in her home state? Why did I, and many others, overestimate Harris’ victory in California? In this blog post, I will attempt to answer these questions, with respect to decisions by the Harris and Trump campaigns.
Anti-Incumbency Sentiment
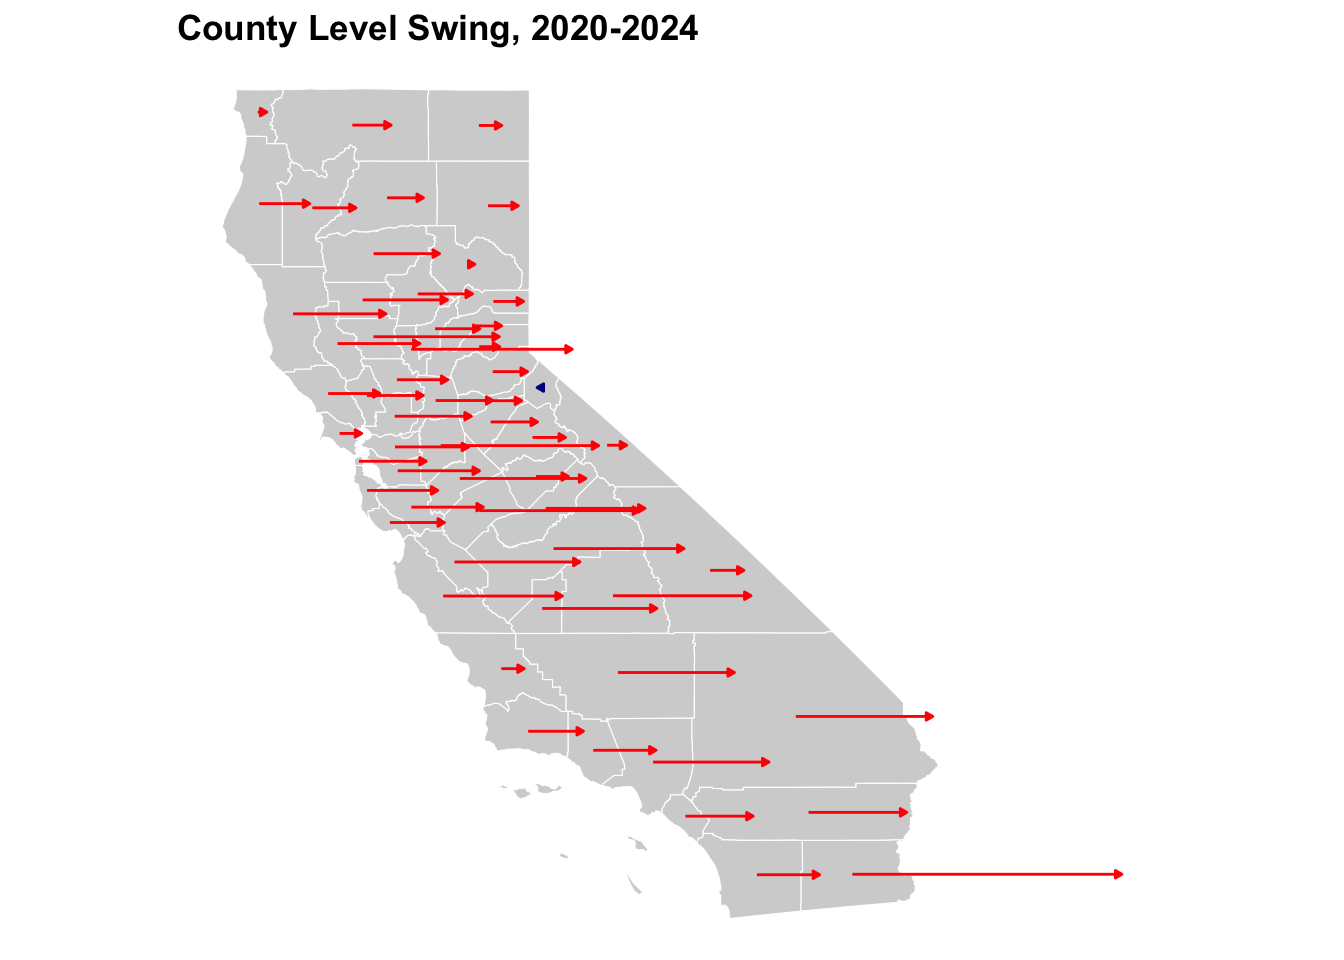
One of the main stories in the aftermath of the 2024 election is the broad and uniform rightward shift of nearly every county in the United States, and California was no exception. As seen below, every single county in California shifted right compared to 2020, with the exception of small Alpine County. In fact, Trump flipped 10 counties that Biden won in 2020: Butte, Fresno, Imperial, Inyo, Lake, Merced, Riverside, San Bernardino, San Joaquin, and Stanislaus.
Trump’s county flips and increased margins in California and the broad rightward swings across the country might be able to be explained by the same reason: anti-incumbent sentiment. On Election Day, incumbent President Joe Biden had a 38.4% approval rating and a 56.5% disapproval rating. As his Vice President, Kamala Harris was inexplicably attached to the Biden Administration. Nonetheless, in her campaigning, she did not make an effort to distance herself from Biden. Incumbents, if extremely unpopular, tend to lose reelection. Voters could have treated Harris as the de facto incumbent president, and revolted against the unpopular incumbent. In my model, I included June presidential approval, but I did not treat Harris as the incumbent president, and as a result the effects of Biden’s disapproval on her forecasted vote share were blunted. Hence, her forecasted vote share might have been lower and more accurate if my model regarded her as the incumbent as voters seemed to do.
Trump’s Inroads with Nonwhite Voters
However, as we can see, not every county had the same magnitude of rightward swing. Southern California counties, like Imperial, Los Angeles, and Riverside counties, and Central Valley counties, such as Tulare, Merced, and San Joaquin, saw much larger rightward swings, compared to Northern and Sierra Nevada counties such as Placer, Plumas, or Del Norte.
Why do we observe such a difference? It’s the voters in these counties. The California counties that swung the most towards Trump are also the least white counties in the state, while the ones that swung the least are the whitest counties. One of the other big stories of the 2024 election is Trump’s gains with nonwhite votes: with Latino and Asian voters in particular. Many speculate this is because Trump focused on issues especially salient to these groups: inflation, the economy, and immigration. In an analysis of TV ads in the final weeks of the campaign, Politico revealed Trump’s ads overwhelmingly emphasized inflation, immigration, and the connection between the two, with specific ads in Southern border states attacking Harris for her involvement in Biden Administration immigration policies and criticizing her record prosecuting immigrants and criminals during her time California law enforcement. Studies have shown that television ads do have persuasive power. Hence, it is possible that these targeted ads were well received by Latino audiences, particularly those in California and other states bordering Mexico, and these traditionally Democratic voters gravitated towards Trump, the candidate they felt spoke more about the issues they cared about.
As seen below, there is a strong negative linear correlation between how Hispanic a county is and its 2020-2024 rightward shift, with a correlation coefficient of -0.84. The more Hispanic a county is, the more it swung right between the 2020 and 2024 elections. Similarly, there is a slightly negative linear correlation between how Asian a county is and its swing right, though this is less strong with a correlation coefficient of -0.15. To assess the strength of these relationships, I fit an OLS linear regression using counties’ percentage of Hispanic and Asian residents to predict 2020-2024 vote shift. The model finds that as the percentage of Asian and Hispanic/Latino in a county increases, the more the county shifted right between 2020 and 2024, with both of these predictors being statistically significant. Trump’s inroads with Latino and Asian voters seems to be largely responsible for Harris’ underperformance in California. These two factors explain over 73% of the variation in the vote shift in California counties, which is a substantial amount of predictive power. But, this means there’s around 27% of the variation in the 2020-2024 shift left to decipher.
| County Demographics and 2020-2024 Swing | ||||
| term | estimate | std.error | statistic | p.value |
|---|---|---|---|---|
| (Intercept) | 0.79083280 | 0.72601754 | 1.089275 | 2.807824e-01 |
| hispanic_pct | -0.21903213 | 0.01793114 | -12.215183 | 2.679007e-17 |
| aapi_pct | -0.08893262 | 0.03621653 | -2.455581 | 1.725408e-02 |
Democratic Turnout Decline
The shrink in Democratic margins in California cannot be solely due to Trump’s persuasion to Latino and Asian voters. Voter turnout declined compared to 2020 in California, with the state casting just shy of 2 million fewer votes in 2024 than 2020. But, a closer look reveals that this turnout decline is uneven. As shown below, every county except Alpine County cast fewer votes for the Democratic presidential candidate in 2024 compared to 2020, but this is not true on the Republican side: only around half of California’s counties cast less votes for the Republican candidate in 2024 compared to 2020.
In summary, more Democrats abstained from voting than Republicans did California. If Trump won on persuasion alone, we should see these points fall on (or at least parallel to) the red line, where Republican vote gain is directly proportional to Democratic vote loss. But, these points are scattered in between this red line and the black dotted line, which represents equal vote change between Democrats and Republicans. Therefore, in the vast majority of California counties, a combination of asymmetric turnout declines and modest Trump persuasion and mobilization narrowed Harris’ predicted margin.
Because California has been considered a guaranteed win for the Democratic nominee for the past few decades, candidates seldom campaign in the state and write it off as an automatic cache of electoral votes for the Democrat, and instead only visit the state to fundraise. Therefore, the insights we can draw from analyzing the campaign strategies in California are limited. However, using this lens may be particularly useful for analyzing the 2024 results. Harris made zero campaign stops in the state, while Democratic Vice Presidential candidate Tim Walz made a single speech at an event in Los Angeles. However, Trump made a media splash when he held a rally in California’s Coachella Valley in October, where like his rally in Democratic New York City, he used the opportunity to criticize the failures of blue state governance. Trump appealed to California Republicans’ and independents’ dissatisfaction with their state government, attributing the state’s condition to Harris, who served as California’s Attorney General and then United States Senator. It is possible that Trump’s gambit, while ridiculed, might’ve paid off, as California, and specifically Riverside County (where his rally was held) had significant rightward shifts, as did New York, where Trump held rallies in the Bronx, Long Island, and Manhattan. His visit to California could’ve energized Republican voters, and thus brought more of them out to vote in 2024 compared to 2020.
Once again, there is not much we can speak to about the issues Harris (or Trump) campaigned on in California, since neither directed much campaigning or messaging in the state. But, seemingly due to the electoral structure of the presidential election, and California’s status as a safely Democratic state, Harris was not incentivized to campaign in the state. But, this hyperfocus on swing voters, such as white suburbanites might have had a perverse effect on the nonwhite voters at the core of the Democratic coalition. Harris staffers were reportedly frustrated that the Harris campaign had neglected outreach to Black and Latino voters in Philadelphia. Perhaps the Latino voters in California felt the same sense of neglect by the Harris campaign. Enos and Fowler (2016) find that candidates’ ground campaigns significantly increase turnout in the states they heavily target. Similarly, Darr and Levendusky (2013) argue that campaigns should, and usually, concentrate ground game efforts on core areas of strength, to mobilize and turn out their base. Harris, seeing California as a guaranteed 54 electoral votes on her path to 270, could’ve made no efforts to campaign to the Democratic base in the state, while those who faced more competitive elections, did. This could be why Harris (and Adam Schiff) underperformed in California at the same time Democrats flipped 3 congressional seats in the state. Due to lack of core voter canvassing, Latino turnout and support for Harris in California and other states eroded.
Final Thoughts
In summary, numerous forecasts, including my own overestimated Vice President Harris’ vote share in the state of California, while underestimating former President Donald Trump’s performance in the state. I discussed three areas of why the election outcome in California deviated from the predictions. First, anti-incumbent and economic fundamentals mattered more than previously believed, hence the incumbent Vice President Harris broadly underperformed across California and the country as a whole. Second, Trump gained more ground with Latino, and to a lesser extent, Asian voters. As a result, the swing toward Trump was exacerbated in California, as a state with one of the highest proportions of Latino and Asian voters. Finally, potentially due to hyperfixation on swing voters, the Harris campaign failed to mobilize the core voters of the Democratic coalition, and thus Democrats did not turn out to vote for Harris in the solidly blue state of California, causing an asymmetric decline in voter turnout that further decreased Harris’ margin of victory in California. It is my contention that these are the main three reasons why Harris won California by a margin of 11 points less than what myself and other forecasters predicted.
For the past three months, I have used this blog as a psephological exercise: to explore and better understand what factors influence elections, and how we can use these insights to predict voter behavior. I hope that these efforts, and my writing about them, can be considered more than just political hobbyism. While it is fun to analyze elections and predict results, important principles lie beneath this amusement. Voting is a fundamental right. We get the pleasure of forecasting elections because we have the privilege of being part of a democracy, where we don’t know the outcome of an election until all votes are cast and counted. Elections impact peoples’ lives; and we can change attitudes and shape our own future by understanding the mechanisms of campaigns that we’ve analyzed. In essence, election analytics is much more consequential to our society than it first appears to be.
It is my hope that this semester-long class assignment is not the end, but the beginning of my work in election analytics.Thank you for following along with me, and I hope you’ll join me again next election!